

ABA Graphing Software
Live todayABA graphs that build themselves from session data
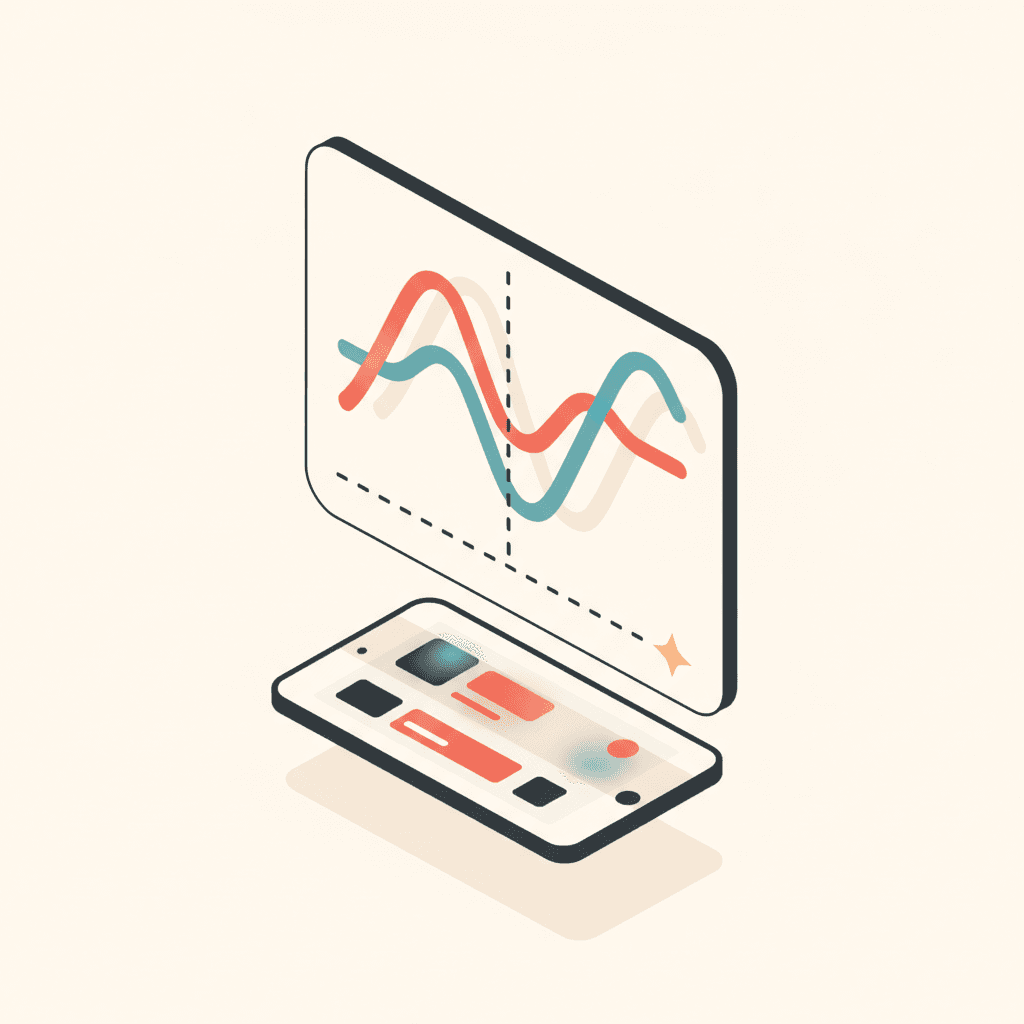
One point per session, a line per phase and the mastery line on the chart — so BCBAs make phase decisions from data they can trust.
What is ABA graphing software?
ABA graphing software turns session data into the line graphs behavior analysts use to judge progress: time on the horizontal axis, the behavior measure on the vertical axis, phase lines and a goal line. In TargetFlo the graph is created automatically from data collection, so nothing is re-keyed into a spreadsheet. See the 9 features BCBAs need and the clinical data collection guides.
At review
Live todayGraphs a BCBA can make decisions from
Each submitted session adds a point in the target's mastery measure. Phases get their own lines and markers, and the threshold is drawn on the chart.
- Mastery evaluated over the last sessions in the current phase
- Phase changes recorded with who, when and why
- Client → Programming → Graph on any accepted target
- Read-only session view for supervisors and admins
Capabilities
What the graph does today
Accurate to the product, including what is not there yet.
One point per session
Each submitted session adds a point in the target's own measure — percent independent, rate, seconds, percent of intervals or steps.
A line per phase
Baseline, treatment, maintenance and generalization each get their own line. The line never runs across a phase change.
Phase-change markers
Dashed vertical markers show when the BCBA changed the phase, with who, when and why recorded.
The mastery line
Your threshold is drawn on the chart. A meets-mastery badge appears when the rule is satisfied.
Direction-aware
Reduction goals use lower-is-better, so the line and badge read correctly for behavior targets.
Frozen at submit
Summaries are computed by the server and frozen, so later programming edits never rewrite a past graph.
Hover for the facts
Each point shows the date, phase and number of trials behind it.
A BCBA decision
Mastery is a badge only. Phase changes are made by a BCBA, never automatically.
At a glance
Graph features at a glance
| Feature | Available | Notes |
|---|---|---|
| Point per session | Yes | Measure follows the target type |
| Separate line per phase | Yes | Baseline, treatment, maintenance, generalization |
| Phase-change markers | Yes | Dashed, labeled |
| Mastery threshold line | Yes | At least or at most |
| Trend line | Not today | Not part of the graph yet |
| Cumulative record | Not today | Not part of the graph yet |
Clinical data collection
Learn the method behind the graph
Measurement, mastery, phases and review — each guide ends with how it works in TargetFlo.
FAQ
ABA graphing FAQs
Where to find graphs, what they show and what is not there yet.
Related features
See a target graph in the demo
Book a demo. We collect a few sessions, watch the graph build, and show the mastery line and phase markers.